
Every candle records four prices in one period: Open, High, Low, Close.
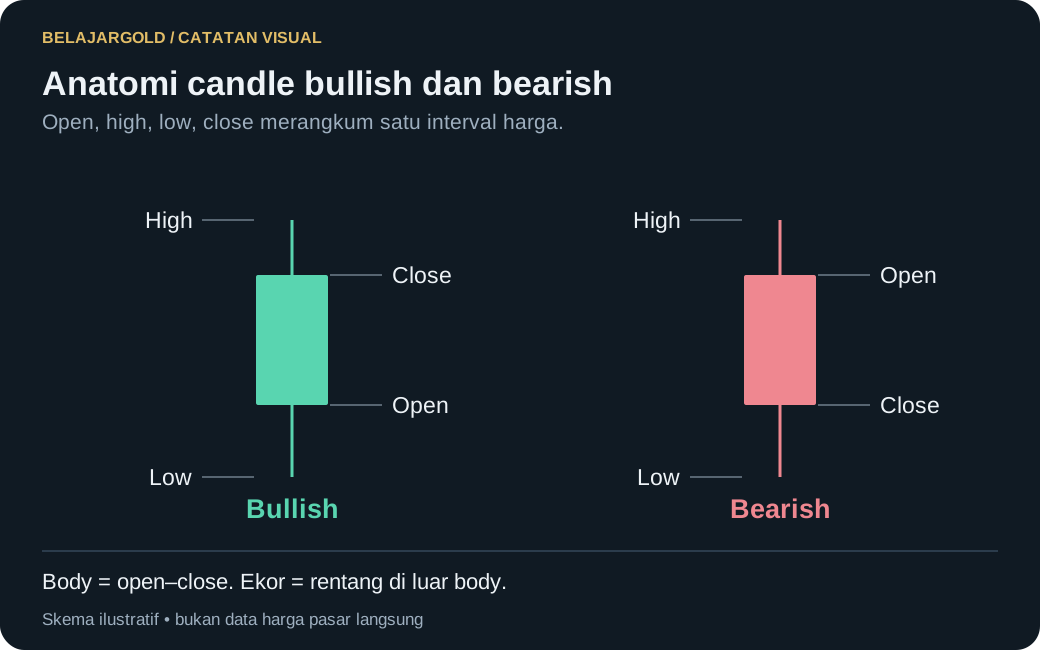
- Body — the distance between open and close. A long body = a decisive move in one direction.
- Wick / shadow — the distance from the body to the high/low. A long wick = price went there and was then rejected.
- Color — usually green/white when close > open (bullish), red/black when close < open (bearish).
How to read it
Ask three things: (1) who closed in the winning position — buyers or sellers? (2) how convinced were they, judging by the body length? (3) was there rejection, judging by the wicks?
Key points
- Body = conviction. Wick = rejection. Color = the winner of that period.
- A single candle rarely means much without the candles around it.
Disclaimer risiko: seluruh konten di situs ini disediakan untuk tujuan edukasi, bukan nasihat keuangan, sinyal, ajakan transaksi, atau janji keuntungan. Trading memiliki risiko tinggi dan dapat menyebabkan kehilangan sebagian atau seluruh modal. Pelajari legalitas penyedia layanan sesuai yurisdiksi Anda.